Task Description: This weeks maths task is all about graphs, which graph?, we needed to read the graph about Favourite Family Holidays and answer some true/false questions. As we need to always look back at the graph to help and tell the percentages for each statement given.
Which Graph? Name: Paige.S
WALT- Analyse data in graphs to answer questions
Using the graphs above to help you answer these statements below.
Statement
|
True or False or Can’t Tell
|
Clearly shown on Bar Graph, Pie Graph, Both or Neither
|
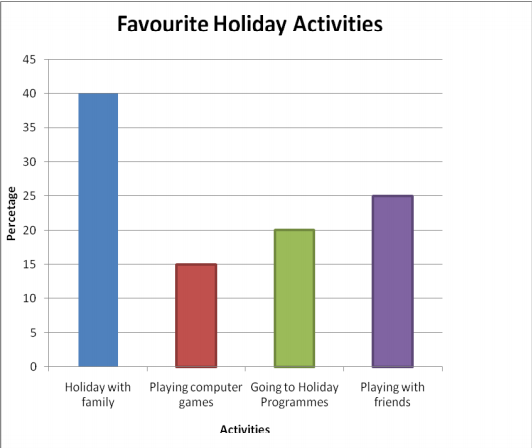
40% said their favourite activity is going on holiday with their family.
|
True
|
Bar Graph
|
Going to holiday programmes was a more popular choice than playing with friends.
|
False
|
Both
|
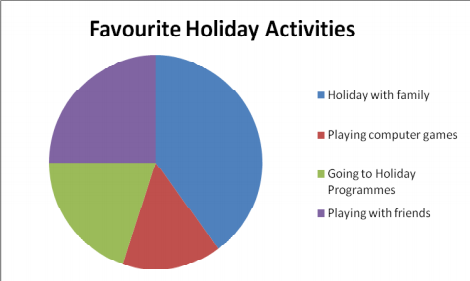
A quarter said their favourite activity is playing with friends.
|
True
|
Both
|
People like to take their friends on family holidays.
|
True
|
Both
|
10% more said their favourite activity is playing with friends than said playing with computers.
|
True
|
Bar Graph
|
Together being on holiday with family and playing with friends makes by more than half the votes.
|
False
|
Both
|
The most popular activity was going on holiday with family.
|
True
|
Both
|
A third said their favourite activity is going to holiday programmes.
|
False
|
Bar Graph
|
Twice as many people picked going on holiday with their family than picked going to holiday programmes.
|
True
|
Bar Graph
|
No comments:
Post a Comment